Advanced PowerPoint Mock Exam
As an administrative assistant at a sales-driven company, you've been tasked with preparing a Quarterly Business Review (QBR) presentation for the executive team. The presentation will highlight sales performance, trends, and key insights from the past quarter to help guide strategic decision-making.
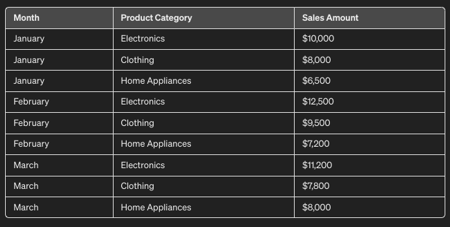
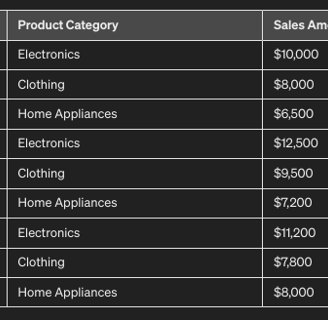
1. Create a PivotChart in Excel to visualize the sales data. For example, you could create a bar chart showing sales revenue by product category or a line chart displaying revenue trends over the quarter.
2. Customize the PivotChart to make it visually appealing and easy to understand. Add titles, axis labels, legends, and other chart elements to provide context and clarity.
3. Open Microsoft PowerPoint and create a new presentation.
4. Insert a new slide for the QBR presentation and choose a suitable layout for your PivotChart.
5. In Excel, copy the PivotChart and paste it directly into the PowerPoint slide. Alternatively, you can insert the PivotChart as a linked object to ensure it stays up-to-date if the data in Excel changes.
6. Resize and position the PivotChart on the slide as needed, and adjust the slide layout to accommodate additional content such as titles, captions, and annotations.
7. Use the insights gained from the PivotChart analysis to provide context and insights in your presentation. Highlight key trends, performance metrics, and areas of opportunity or concern.
8. Supplement the PivotChart with additional slides containing supporting data, analysis, and recommendations. Include tables, graphs, and visualizations to further illustrate your points and reinforce your key messages.
Submit your answer to actira.tt@gmail.com